This article is part of our Collette Calls series.
Coming into 2012, if I were to ask you to name the most toxic pitching assets on the market, I would assume many of you that would have responded would have responded with Bronson Arroyo. Arroyo had the worst FIP (Fielding Independent Pitching) of any pitcher with at least 100 innings of work in 2011 and gave out home runs as if they were going out of style last season, allowing a staggering 46 in 199 innings of work. Only Bert Blyleven and Jose Lima had ever allowed more homers than that, but Blyleven did it in 271.2 innings of work while Lima did it in the same amount of innings, but in the unfriendly confines of then Enron Field.
How does this happen every season, when someone considered on the brink of extinction revive their career to surprise people? Numbers can sometimes tell the story, but so can video and some other tools that we have available to us on the series of tubes Al Gore invented.
First, let's take a look at the numbers of both guys to see if there was anything in the secondary stats to point at an improvement. Arroyo had a career strikeout rate of 5.8 coming into 2012 and had seen his strikeout rate drop each of the previous four seasons from 7.3 in 2008 down to the 4.9 rate last season. He has always been a guy that would limit his walks, which meant a lot of pitches were being put
Coming into 2012, if I were to ask you to name the most toxic pitching assets on the market, I would assume many of you that would have responded would have responded with Bronson Arroyo. Arroyo had the worst FIP (Fielding Independent Pitching) of any pitcher with at least 100 innings of work in 2011 and gave out home runs as if they were going out of style last season, allowing a staggering 46 in 199 innings of work. Only Bert Blyleven and Jose Lima had ever allowed more homers than that, but Blyleven did it in 271.2 innings of work while Lima did it in the same amount of innings, but in the unfriendly confines of then Enron Field.
How does this happen every season, when someone considered on the brink of extinction revive their career to surprise people? Numbers can sometimes tell the story, but so can video and some other tools that we have available to us on the series of tubes Al Gore invented.
First, let's take a look at the numbers of both guys to see if there was anything in the secondary stats to point at an improvement. Arroyo had a career strikeout rate of 5.8 coming into 2012 and had seen his strikeout rate drop each of the previous four seasons from 7.3 in 2008 down to the 4.9 rate last season. He has always been a guy that would limit his walks, which meant a lot of pitches were being put in play by the opposition. The main issue that plagued him was the long ball as 16 percent of the flyballs batters put in play last season against Arroyo left the park. That rate was higher than any of his seasons at Fenway Park and well above the 10 percent career rate he had coming into last season. His batting average on balls in play was right in line with his career norms.
At best, we should have expected Arroyo's ERA to come down with some regression to his home run to fly ball rate, but the ERA drop this season is not as surprising as the recovery of his strikeout rate. How does a guy stop a four-year trend of declining strikeouts and recover nearly a full strikeout per nine innings? Is it simply because he gets to pitch against the talentless Astros and Cubs rosters more frequently than others or is there some skills growth for the aged veteran?
To be perfectly honest, it is impossible to predict these kinds of dead cat bounces for veteran pitchers, especially with strikeout rates. It is easy to go back and look at what Arroyo is doing differently this season, but nothing he was doing in 2011 predicted these results for 2012. When doing any kind of look into what a pitcher is doing, it is always wise to dive into the freely available tools found on the pitcher cards at BrooksBaseball.net.
Looking at Arroyo's card, we can see what he has done for his career, or by year, or even by month within a year. We can look at pitch usage, pitch outcome, sabermetric outcomes, as well as results and averages. We know in looking at the card that Arroyo threw a version of his fastball or a changeup 76 percent of the time while going with a breaking ball the other 24 percent of the time. The table below shows the results of each pitch:
| PITCH | Freq | BA | SLG | ISO | BABIP |
| Four-seam | 30.0% | 0.330 | 0.628 | 0.298 | 0.333 |
| Sinker | 22.0% | 0.317 | 0.485 | 0.168 | 0.313 |
| Cutter | 2.0% | 0.263 | 0.474 | 0.211 | 0.250 |
| Slider | 11.0% | 0.253 | 0.494 | 0.229 | 0.327 |
| Curve | 13.0% | 0.309 | 0.580 | 0.272 | 0.317 |
| Changeup | 22.0% | 0.307 | 0.642 | 0.324 | 0.281 |
When looking at his overall numbers from last season, the batted ball outcomes above should not be very surprising. What should stick out are his numbers from his use of the cutter and the slider. He only threw those pitches a total of 102 times last season while he threw his four-seam, sinker, and change-up each 167 times or more. He did not have too much success last season, but those two pitches were working for him to some extent in terms of batting average. Everything was hit hard in terms of slugging percentage but at least he found some success with the averages.
Did Arroyo learn something last season? Here is how that above table looks in 2012:
| PITCH | Frequency | BA | SLG | ISO | BABIP |
| Four-seam | 9.0% | 0.431 | 0.759 | 0.310 | 0.396 |
| Sinker | 28.0% | 0.247 | 0.379 | 0.132 | 0.259 |
| Cutter | 7.0% | 0.364 | 0.500 | 0.136 | 0.357 |
| Slider | 19.0% | 0.202 | 0.325 | 0.123 | 0.339 |
| Curve | 22.0% | 0.273 | 0.436 | 0.164 | 0.317 |
| Changeup | 15.0% | 0.349 | 0.605 | 0.256 | 0.325 |
He has thrown his four-seam fastball significantly fewer times this season and with good reason since that pitch is getting crushed at an even higher rate this season. The same goes for his change-up, which continues to be safely put into play at an unacceptable rate. He has given up those pitches to more frequent uses of his breaking ball as well as more cutters mixed in and that has helped him be more effective this season.
Pitch mixture and outcomes are part of the puzzle, but where the pitcher locates those pitches is another. For that, we can go to TexasLeaguers.com to see where pitchers are locating pitches and drill down to hitter types, counts, and even pitch types. Let's look at August from this season compared to last season and see if you can notice a difference.
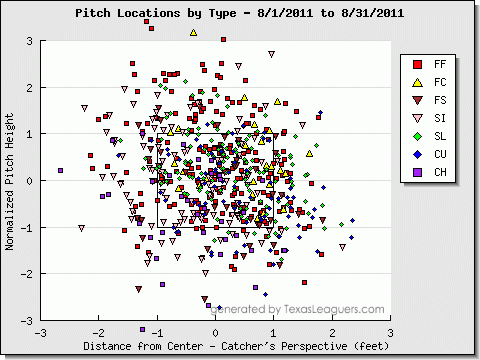
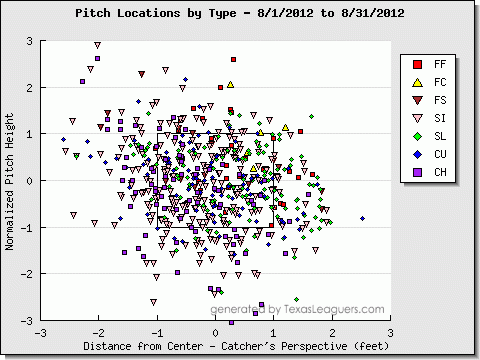
In 2011, he elevated a lot of pitches, mainly his fastball, and hitters treated those pitches accordingly. This season, he is working both sides of the zone as well as the bottom reaches of the zone.
The success Arroyo has found is a result of a change in process, something we expect from veterans when they reach the make or break stage of their career. Those that adapt, survive.
Those that cannot go into fantasy oblivion as Jonathan Sanchez can tell you. These types of changes are tough to predict in March, but if you see something that was having success late in 2012 with a struggling pitcher, watch him closely in 2013 to see if he is trying to repeat what worked for him to see if he too can recover declining skills.