


This article is part of our Collette Calls series.
After getting over the disgust of the Rays' overall number, what surprised me is how many teams have a high home run rate in May -- 20. As games begin on May 28, 20 of the 30 teams have allowed at least one home run every nine innings this season. In May 2015, 15 teams had a HR/9 rate of 1.0 or higher, but 20 rotations ended up with a final HR/9 of at least 1.0.
If feels like home runs are up this year compared to recent years, but let's see what the numbers tell us.
Teams have played somewhere between 46 and 49 games this season. You probably saw some stories last week
After getting over the disgust of the Rays' overall number, what surprised me is how many teams have a high home run rate in May -- 20. As games begin on May 28, 20 of the 30 teams have allowed at least one home run every nine innings this season. In May 2015, 15 teams had a HR/9 rate of 1.0 or higher, but 20 rotations ended up with a final HR/9 of at least 1.0.
If feels like home runs are up this year compared to recent years, but let's see what the numbers tell us.
Teams have played somewhere between 46 and 49 games this season. You probably saw some stories last week about baseball making its way past the first pole like it is a horse race. It isn't. If we look into the number of plate appearances, and hence batters faced, we're 29.7 percent of the way to meeting 2015's final number of 183,628. If we look at it by a games played total, it is essentially the same number as the 1,436 games played is 29.6 percent of the 4,858 played in 2015.
In 2015, 4,909 home runs were hit league-wide and we have 1,547 home runs in 2016 after the completion of games on May 27. That 1,547 represents 31.5 percent of the 2015 home run total, which means home runs are pacing slightly ahead of last season's pace (29.6 percent). Using a pace formula of (2015 games played * 2016 stat) / (2016 games played), we get the following pace for home runs as well as the other offensive categories:
| STAT | 2015 | 2016 | % WAY | PACE | DIFF |
| HR | 4,909 | 1,547 | 31.5 | 5,234 | 325 |
| R | 20,647 | 6,171 | 29.9 | 20,804 | 157 |
| RBI | 19,650 | 5,906 | 30.1 | 19,980 | 330 |
| SB | 2,505 | 710 | 28.3 | 2,358 | -147 |
We will get back to the other categories in a second, but if home runs continue to be hit at the rate they are in 2016, home runs will be up for a second consecutive season, which is something that has not happened since 2002 to 2004. As it were, the increase in home runs from 2015 from 2014 was the largest move in either direction we have seen this century:
| SEASON | G | PA | HR | DIFF |
| 2001 | 61,325 | 186,933 | 5,458 | n/a |
| 2002 | 68,340 | 186,632 | 5,059 | -399 |
| 2003 | 68,519 | 187,460 | 5,207 | 148 |
| 2004 | 68,880 | 188,541 | 5,451 | 244 |
| 2005 | 68,432 | 186,294 | 5,017 | -434 |
| 2006 | 69,333 | 188,071 | 5,386 | 369 |
| 2007 | 70,143 | 188,623 | 4,957 | -429 |
| 2008 | 69,564 | 187,631 | 4,878 | -79 |
| 2009 | 69,035 | 187,079 | 5,042 | 164 |
| 2010 | 68,923 | 185,553 | 4,613 | -429 |
| 2011 | 68,729 | 185,245 | 4,552 | -61 |
| 2012 | 69,521 | 184,179 | 4,934 | 382 |
| 2013 | 69,267 | 184,872 | 4,661 | -273 |
| 2014 | 69,565 | 183,928 | 4,186 | -475 |
| 2015 | 70,535 | 183,627 | 4,909 | 723 |
If the home runs continue at the current pace, it will be just the second time since 2006 that the league will have eclipsed 5,000 home runs. I'll stop the conspiracy theorists right there to remind everyone that the Mitchell Report was not released until after the 2007 season.
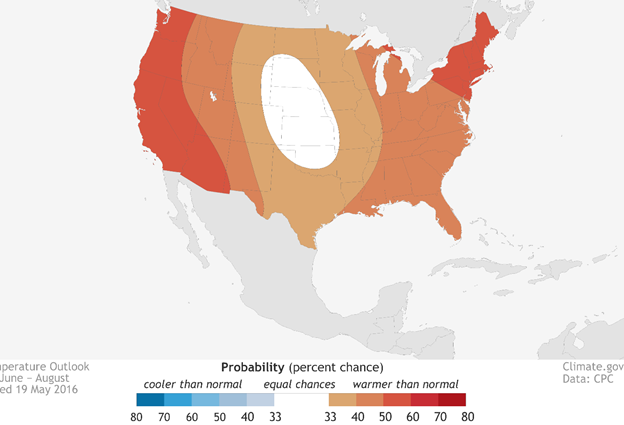
One reason why we might continue to see more home runs - the heat. The National Oceanic and Atmospheric Administration announced earlier this week that this summer is going to be a scorcher. The map below shows the probability that areas will see warmer than normal temperatures for most of the United States this summer with California and the Northeast the areas that likely will be toughest hit. That big white circle of equal chances contains all of one baseball team - the Royals:
We know, from multiple studies on the subject, that heat impacts hitting. Higher than 90 degrees, the distance is noticeable on scatter plots such as the one below by Dr. Alan Nathan:
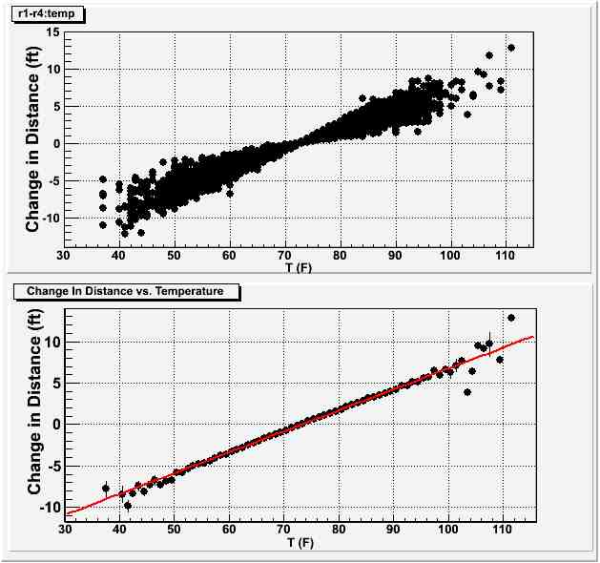
So, an extra 3-8 feet of distance on batted balls in parks like Fenway, Yankee Stadium, Citi Field and Citizens Bank in the Northeast along with Petco, Dodger Stadium, Angel Stadium, both Bay Area yards and Safeco should lead to more homers and not do much if anything to deter the current pace of home runs.
Given the fact home runs are already up and the league-wide ERA is at its highest mark in four seasons, gobbling up groundball pitchers for the next few months might not be a bad idea. As bad as Dallas Keuchel has been this season it's worth kicking the tires on his current price for that alone.
Getting back to the earlier chart, homers are up and thus runs and RBI are up. However, steals are once again down, and we would have to go back to the strike-shortened 1994 season to find the last time the league stole fewer than 2,500 bases.
If you thought 2015 was the renaissance of the long ball, think again -- 2016 is shaping up to be an even bigger year for power production with what is already on the books and what looks to be a very hot summer across most the United States.


